Look up any US stock in seconds
A daily Buy/Sell signal from our StockVane Momentum strategy, a 6-factor quant grade, full financials, valuation vs. history, analyst targets and dividend record on the stocks we track — plus plain-English analysis and free calculators.
Market snapshot
Where the market sits today: our quant score, factor read and the most-watched names.
Market Quant Score
S&P 500 (via SPY) 763.25 -1.11%
As of Oct 17, 2026 · updated daily, not real-time
Factor breakdown
Tracked-universe average (3,000+ tracked stocks): valuation percentile, price momentum, analyst consensus - the same 3 inputs behind every stock's own Quant Rating.
Quant Score is a StockVane algorithm computed from valuation, price momentum and analyst consensus data - not a live AI model, not investment advice. stockvane.com
Trending stocks
The 10 most actively traded names today, by turnover.
| Name | Last | Chg% | Turnover | Quant Rating | Mkt cap | P/E (TTM) |
|---|---|---|---|---|---|---|
| Micron TechnologyUS.MU | 878.84 | -5.63% | 27.26B | 992.56B | 11.82 | |
| NVIDIAUS.NVDA | 214.13 | -1.43% | 26.14B | 5.16T | 27.07 | |
| TeslaUS.TSLA | 354.72 | -2.13% | 22.37B | 1.40T | 328.44 | |
| AppleUS.AAPL | 343.46 | +0.43% | 20.63B | 5.01T | 39.39 | |
| Meta PlatformsUS.META | 709.33 | -3.72% | 14.75B | 1.81T | 26.72 | |
| MicrosoftUS.MSFT | 529.05 | -1.93% | 13.19B | 3.93T | 29.47 | |
| SpaceXUS.SPCX | 146.03 | -1.74% | 12.91B | 1.92T | -216.34 | |
| Advanced Micro DevicesUS.AMD | 528.75 | -5.95% | 12.13B | 863.17B | 135.58 | |
| SanDiskUS.SNDK | 1,299.30 | -6.85% | 11.88B | 188.82B | 17.62 | |
| IntelUS.INTC | 89.85 | -5.79% | 11.22B | 472.03B | -42.99 |
Today on the market
The day’s biggest moves, plus quick ways in: screener, ranked lists, side-by-side comparison and how our Quant Rating has held up.
Free calculators
No sign-up, no ads in the result, just the math.
Explore by theme
Curated baskets, from AI infrastructure to the Pelosi portfolio.
Latest analysis
Forecasts, broker reviews and how-to guides from our desk.
- Duke Energy’s Dividend Is Boring by Design. That’s the Entire Point.
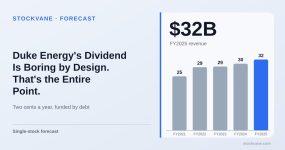 Duke Energy has raised its quarterly dividend two cents every year, even in 2022 when EPS fell 36%. Capital spending has outrun operating cash flow in four of five years, so who pays for the boring dividend? Debt, mostly.
 - Fortinet’s Business Is Fine. Wall Street’s Rating Says Otherwise.
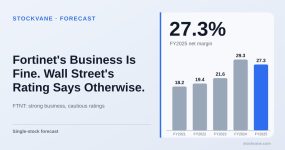 Only 22% of 27 analysts rate Fortinet a buy, yet revenue grew 26% last quarter and operating margin is about 31%. The reason is price: 60 times earnings and 16.7 times sales. Here is what the hold rating assumes and what would break it.
 - Emerson Electric Costs 33 Times Earnings, 55% Above Its Own Five-Year Average
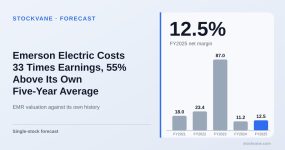 Emerson Electric trades at 32.8 times trailing earnings, 55% above its own five-year average of 21.2 and only slightly above its industry at 30.2. Operating income jumped 32% on 3% revenue growth. Is that enough to justify the price?
 - Kinder Morgan Owns America’s Pipelines. The Dividend Finally Caught Up to the Cash Flow.
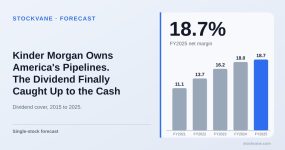 In 2015 Kinder Morgan paid $4.22B in dividends on $1.42B of free cash flow. In 2025 it paid $2.60B on $2.89B. The dividend has caught up, but cover fell from 1.75x in 2021 to 1.11x in 2025, and rising capital spending is the reason.
 - Equal-Weight vs. Cap-Weight: A Different Way to Own the S&P 500
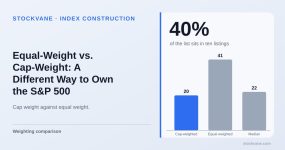 Ten stocks make up 40% of our 300-stock list by value. Equal weighting beat cap weighting by 20 points over 12 months, then tied it over six. A few outliers explain much of that gap, and the median stock tells a quieter story. Here is how to read it.
 - Dell’s AI Server Backlog Is Real. The Margins on It Aren’t Great.
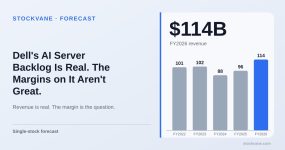 Dell booked $90.8 billion of revenue in half a year, 80% of all of fiscal 2026. But each extra revenue dollar brought about 8 cents of gross profit. We test the AI server story against the margin arithmetic, with the data we have.